 |
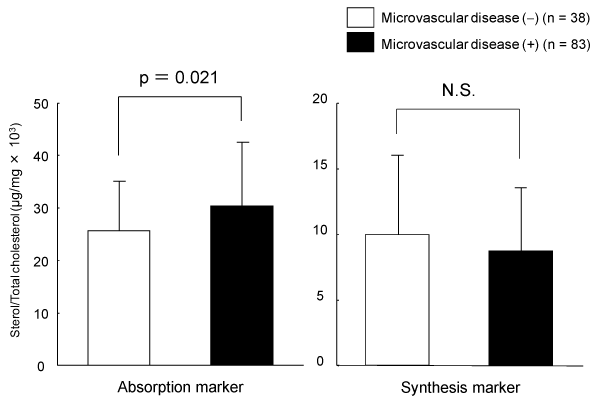
| Figure 2: Bar graphs illustrating the differences in the levels of cholesterol absorption and synthesis markers in patients with and without microvascular complications. The black boxes indicate patients with microvascular complications while the white boxes indicate those without microvascular complications. |