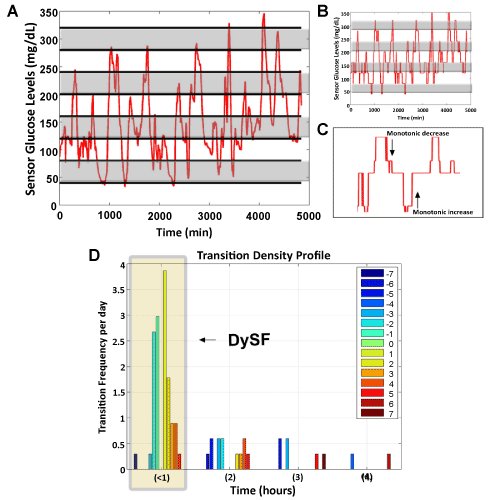
A) Patient input glucose data, illustrating the 40 mg/dL increments in alternating grey and white.
B) Smoothed input data in bins.
C) Blow-up of data in (B) highlighting the monotonic changes to be recorded in the
D) Transition Density Profile which compiles monotonic changes that occur in a specific time interval. The shaded region shows all the monotonic transitions that occurred in less than 1 h. DySF is calculated as the sum of the number of transitions greater than one, weighted by the magnitude of the transition. (Example above: DySF = 0.3*|-7| + 0.3*|-3| + 2.6*|-2| + 1.75*|2| + 0.9*|3| + 0.9*|4| + 0.3 *|5| = 19.5. The weights listed as 0.3 and 2.6 for example are determined by the number of actual transitions occurred divided by the length of time the sample set is measured. Since there was one transition of -7 bins that occurred during the 5000 minutes or 3.4 days measured, we get 1/3.4 = 0.3 to be our weighted factor for this transition.)