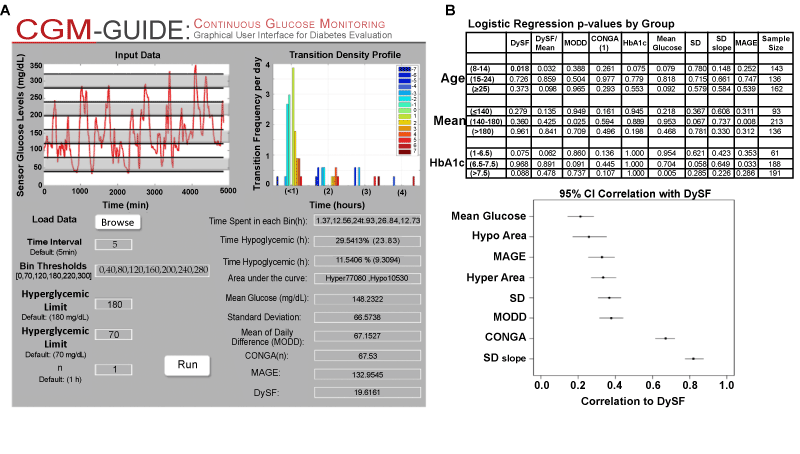
A) Glycemic Variability Profile for one patient with type 1 diabetes created by the CGM-GUIDE software [18]. Provides user adjustable bin thresholds, transition density profiles, statistics (mean, SD, glycemic times/areas), and metric calculations including DySF, CONGA, MODD and MAGE.
B) Table of p-values from individual logistic regressions to predict the number of hypoglycemic episodes (HE) based on the described metrics. DySF shows the most predictive power among metrics in children 8-14 yr (p-value= 0.018).
C) Correlation of previous statistics and metrics to DySF. Confidence intervals were obtained as the central 95% of correlation coefficients observed on the basis of 10,000 bootstrap samples (of size equal to the original sample). Dots represent the means of the resulting empirical distributions and are essentially equivalent to the one sample point estimates from the original data.