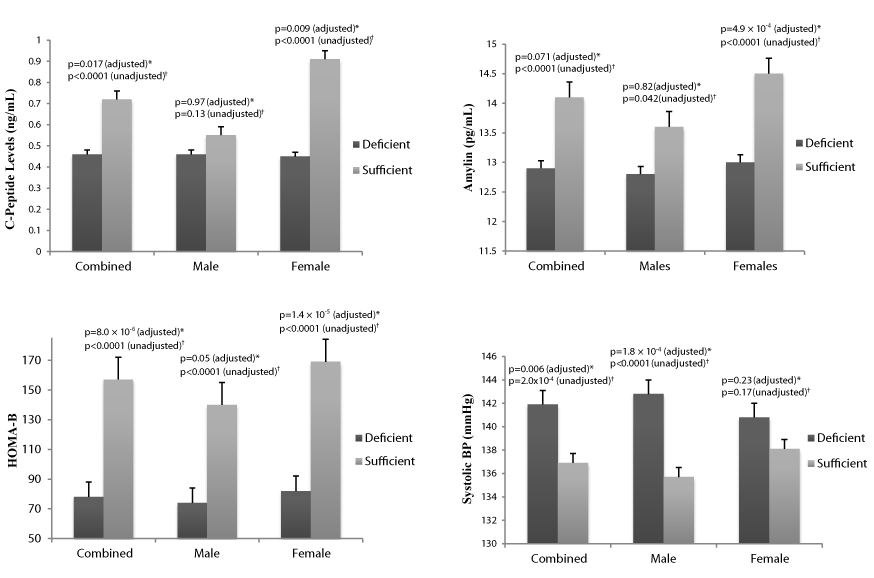
 *Multivariate regression analysis showing association of 25(OH)D with quantitative trait adjusted for T2D, age, BMI and gender (combined only), †Independent t test
comparing mean levels of quantitative traits in vitamin D deficient (<50nmol/L) versus vitamin D sufficient (≥ 50nmol/L) participants