 |
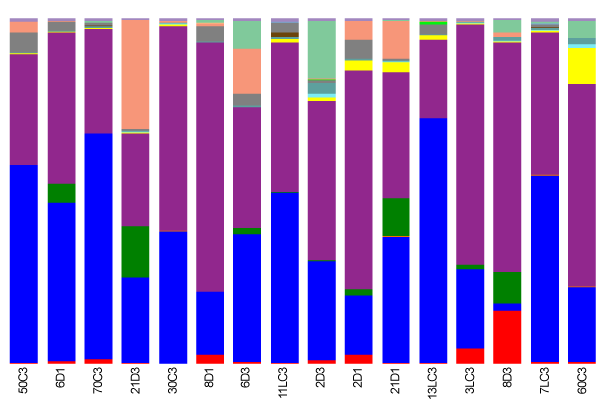
| Figure 2: Bar Charts of 454 sequencing results reflect qPCR analysis with increasing abundance of Firmicutes especially Clostridiales and Bacilli in type 2 diabetics (D) resulting in an increasing ratio of Firmicutes:Bacteroidetes between the time points (T1, samples taken before intervention; T3, samples taken after 4 month of intervention). Verrumicrobia and enterobacteria are also higher abundant in type 2 diabetics and enriched in obese patients (OC). Lean controls (LC) showed an according lower abundance of named bacterial 1E8 groups and higher abundance of Bacteroidetes. |