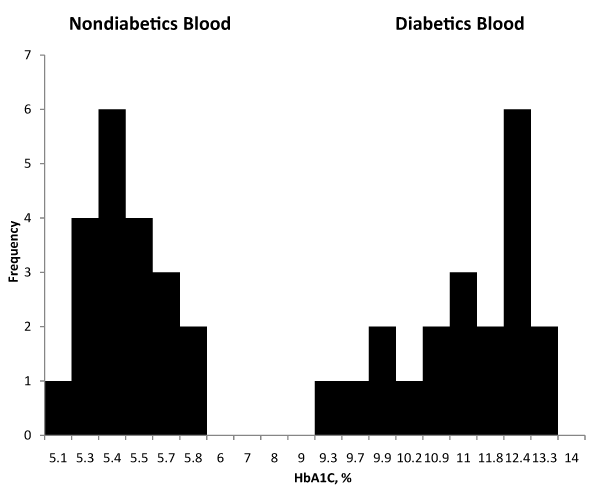
*The mean diabetics HbA1C was 11.4 ± 1.2% and the mean nondiabetics HbA1C was 5.5 ± 0.2%. Based on Student’s t-test a T value of 12.0 with 38 degrees of freedom was obtained with a difference between the two means that is statistically significant (p<0.05) .