|
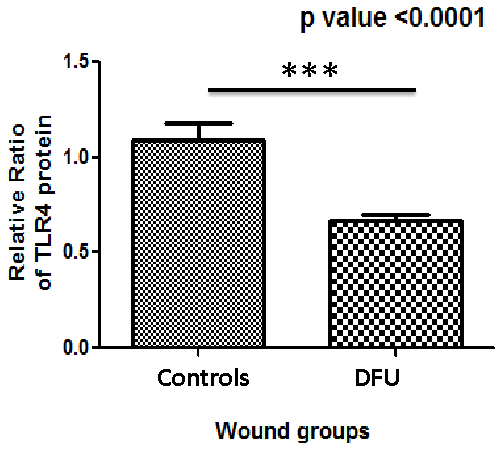
| Figure 3: TLR4 protein expression was analyzed in 43 DFU patients and 8 controls. Tissue samples collected during debridement process from control {C} and DFU patients {P} were homogenized and Western blot analysis was performed for expression of TLR4 and GAPDH protein. Alpha Imager 2200 software version 3.1.2 was used to quantify band density. The relative percent ratio of protein (TLR4 vs. GAPDH) was calculated. Unpaired t test was used to check the difference between the mean values of TLR4 protein in DFU and control subjects using Graph Pad Prism. A two tailed p value < 0.05 was considered as statistically significant. Bar Graph showing down regulation of TLR4 protein in wounds of T2DM patients compared to controls (p value=<0.0001, difference between means=0.42, Standard error of mean=0.08). |