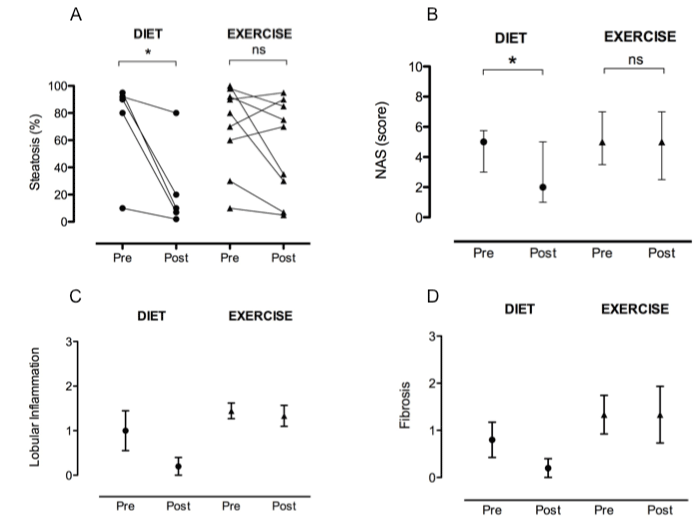
Individual change in steatosis (Panel A, *p<0.05 Wilcoxon signed rank test) and median score change in NAFLD activity Score (NAS) (Panel B, *p<0.05Wilcoxon signed rank test), Lobular inflammation (Panel C, p<0.05RMANOVA for time x treatment difference between groups at 6 months) and Fibrosis (Panel D, p=NS) assessed by liver biopsy pre and post intervention. Symbols • depicts DIWL and
 depicts EX group.