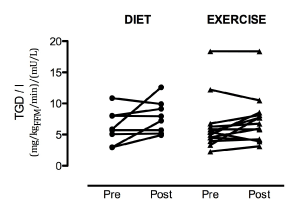
Individual response of peripheral (muscle) insulin sensitivity index to DIWL and EX, illustrated by total glucose disposal (TGD) rate/steady state plasma insulin levels, during the hyperinsulinemic-euglycaemic clamp. Pre- and post-comparison using paired Wilcoxon signed rank test was not significantly different after either intervention.