 |
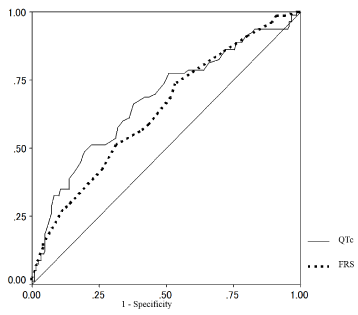
| Figure 1: Receiver operating characteristic (ROC) curve and area under the ROC curve (AUC) showing the ability of heart rate-corrected QT interval duration (QTc) and the Framingham 10-year coronary heart disease risk score (FRS) for arterial stiffness defined as pulse wave velocity > 1800 cm s-1. We compared AUC between the two groups using the ROCKIT. Value of p was as follows: QTc vs. FRS, p=0.6532. |