|
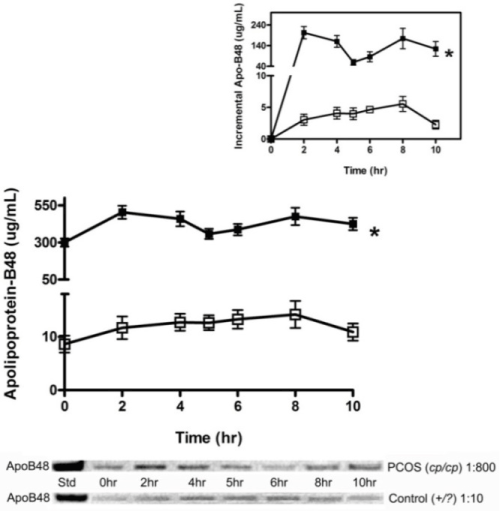
| Figure 2: The postprandial plasma apoB48 response (AUC and AUC) following a high fat meal challenge in the JCR: LA-cp PCOS-like rodent model. Data are shown for PCOS cp/cp rats (filled squares) (n=9) and control rats (open squares) (n=9) as mean ± SEM. The total AUC and the change in apoB48 from fasted concentrations are shown (inset) and represent the incremental area under the curve (iAUC). Both the postprandial apo-B48-AUC and the apoB48-iAUC was significantly greater in the PCOS cp/cp rats compared to control rats, (*) p<0.0001. The lower panel represents a typical western blot detecting plasma apoB48 following the highfat meal (0–10 h). |