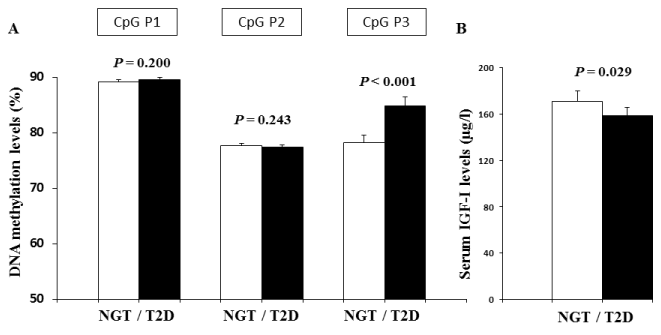
A. T2D patients had significantly increased DNA methylation levels at CpG site P3 (84.8% vs. 74.2%, P<0.001) compared with NGT subjects. But no difference of DNA methylation levels at the CpG sites P1 and P2 between NGT and T2D was observed. B. Circulating levels of IGF-I were lower in T2D patients compared with NGT subjects (152 μg/l vs 169 μg/l, P=0.029 adjusted for age). Data were expressed as mean (DNA methylation levels) / geometric mean (serum IGF-I levels) and 95% CI.