 |
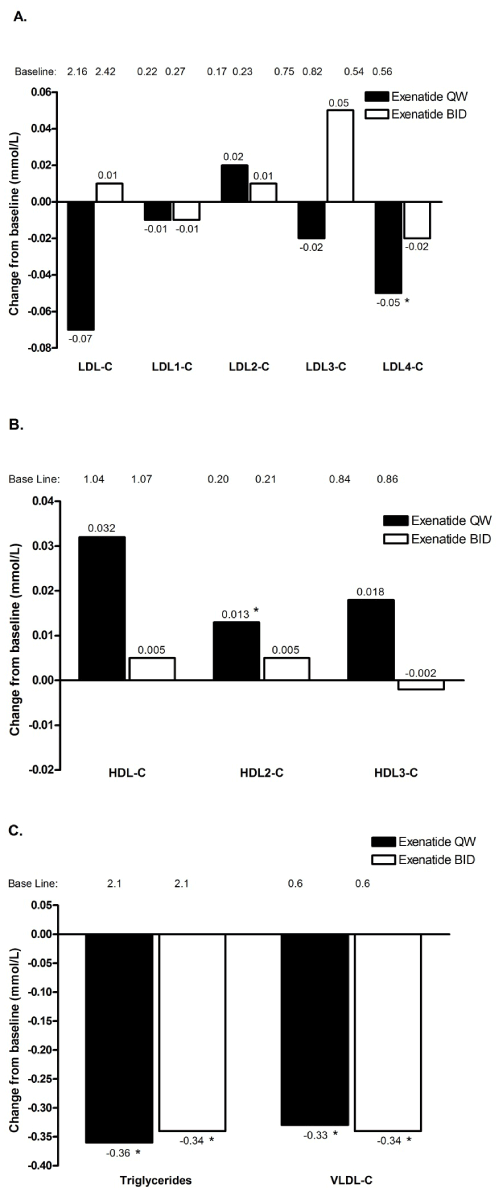
| Figure 3: Effects of exenatide on lipoproteins in the total analysis cohort with an overall normal lipid profile at baseline. Week 30 change data are independent of glycemic improvement and weight loss. (A) LDL-C and its subclasses. (B) HDL-C and its subclasses. (C) Triglycerides and VLDL-C. Adjusted mean. Notes: *Week 30 change from baseline p<0.05. Once weekly, n=106, twice daily, n=105. Abbreviations: BID: twice daily; LDL-C: low-density lipoprotein cholesterol; VLDL-C: very low-density lipoprotein cholesterol; HDL-C: high-density lipoprotein cholesterol; QW: once weekly. Adapted with permission from Chiquette et al. Vasc Health Risk Manag. 2012;8:621–629 [83]. |