 |
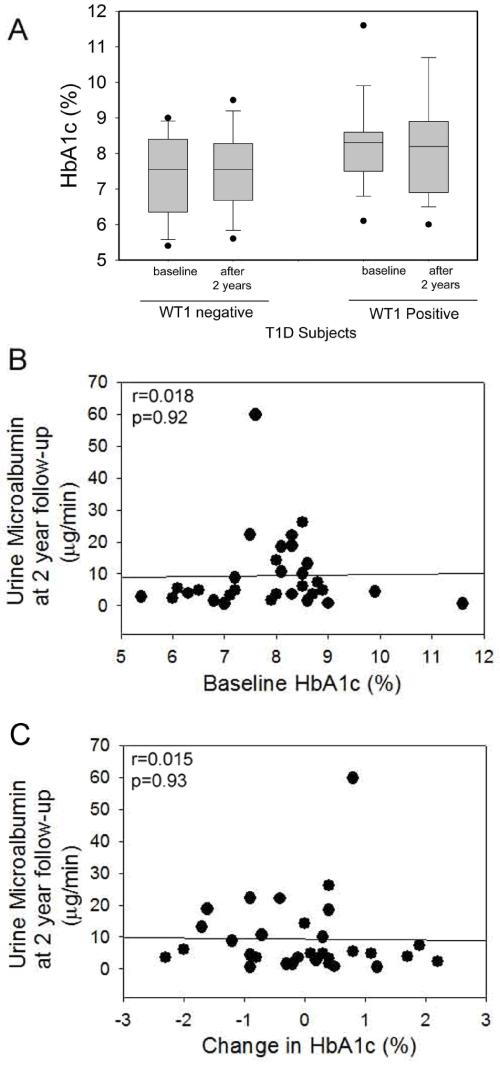
| Figure 3: Relationship between HbA1c and urine microalbumin levels. (A) The box plot shows HbA1c levels, at baseline and at the end of 2 years of follow-up. The boxes indicate median and 25th and 75th percentiles; Outliers are indicated by closed dots. HbA1c levels did not change significantly at the end of 2 years. Linear regression analysis showed a weak relationship of urine microalbumin at the end of two year of follow up with (A) baseline HbA1c and (B) change in HbA1c levels in T1D subjects (n=31). |