 |
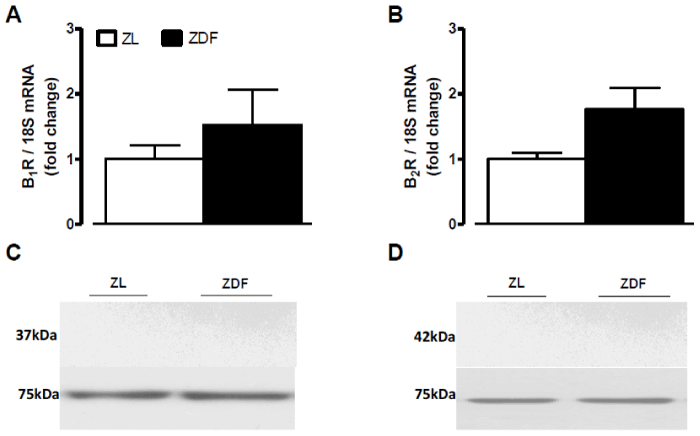
| Figure 6: Expression levels of kinin B1R (A, C) and B2R (B, D) in the white adipose tissue of 12 weeks Zucker diabetic fatty (ZDF) rats and age-matched Zucker lean (ZL) rats. Shown are mRNA (A, B) and protein (C, D) expression levels of B1R (37 kDa) and B2R (42 kDa). Dynein (75 kDa) and 18S mRNA were used as standards. Data are the mean ± S.E.M of 3-8 rats/group. |