 |
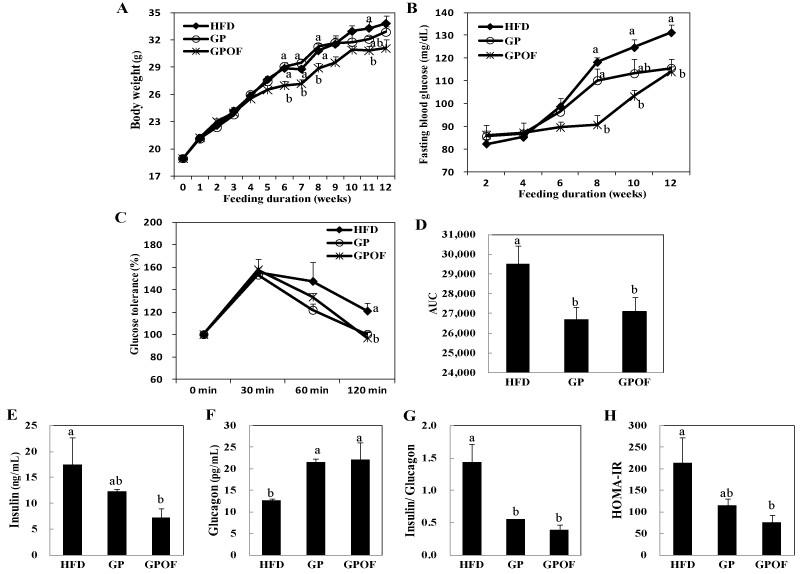
| Figure 3: Effects of GP or GPOF on body weight (A), fasting blood glucose (B), IPGTT (C), AUC (D), plasma insulin (E), plasma glucagon (F), insulin/glucagon ratio (G), and HOMA-IR (H) levels in DIO mice. A-H: Data are the means ± SE (n=10).a,b,c Means not sharing a common letter are significantly different among the groups at p<0.05. HFD, high-fat diet; GP, HFD plus grape pomace extract (0.5%, w/w); GPOF, GP diet plus omija fruit extract (0.05%, w/w); IPGTT, intraperitoneal glucose tolerance test; AUC, area under the curve; HOMA-IR, homeostasis model assessment of insulin resistance; DIO, diet-induced obese. |