 |
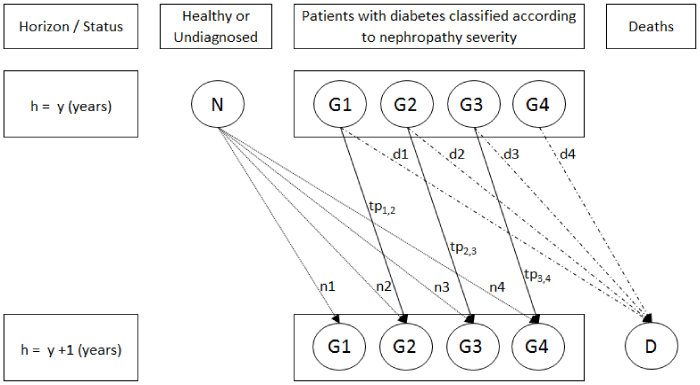
| Figure 1: Diagram of the model. Patients were classified according to severity of nephropathy (groups G1 to G4) and evolution of these groups on one year (from y to y+1) depends on death rates (d1 to d4), new cases (n1 to n4) and probabilities of transitions from one group (tp1,2 to tp 3,4) to another. In usual conditions size remains contant. With screening strategy tp will decrease and thus size of groups will decrease for the more severe (G3 and G4) and increase for the less severe (G1 and G2). |