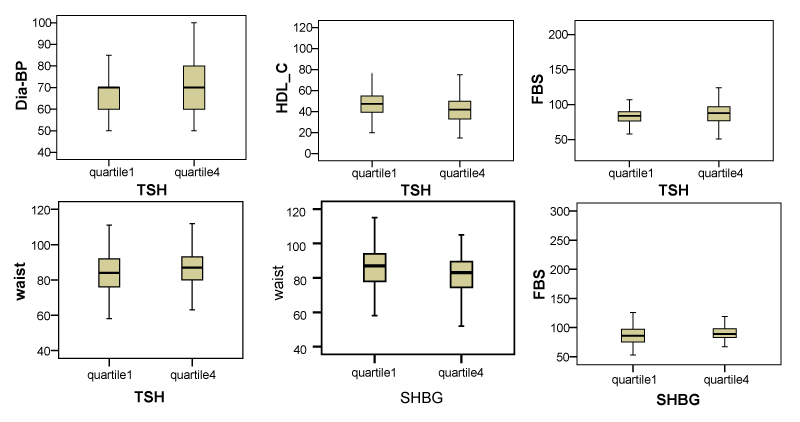
1. We did not present the 95% CI for the mean in figure 1 and we presented the percentiles of 5,25,50,75 and 95. Therefore it seems that their overlaps has no effect on the interpretation of our results
 1. We did not present the 95% CI for the mean in figure 1 and we presented the percentiles of 5,25,50,75 and 95. Therefore it seems that their overlaps has no effect on the interpretation of our results |
| Figure 1: Association of MetS parameters with lower and higher quartile of TSH and SHBG concentration [1]. |