 |
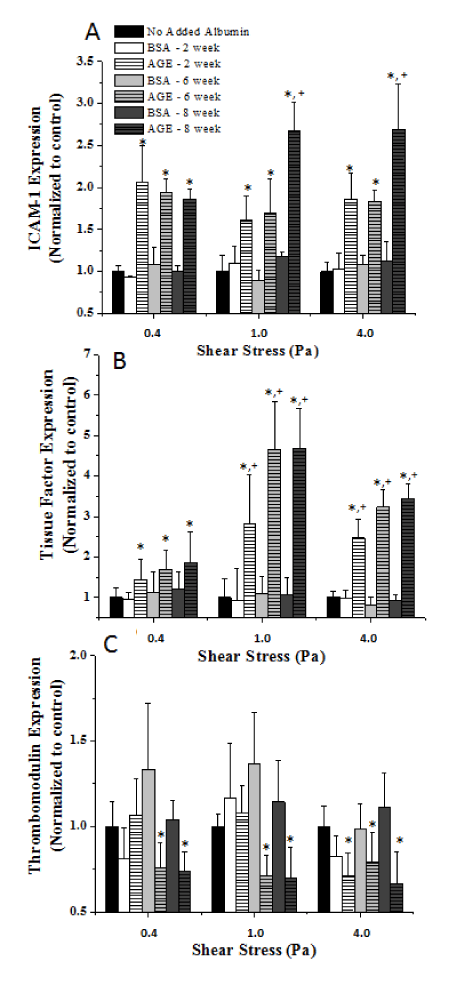
| Figure 3: Endothelial cell (HUVEC) expression of (A) ICAM-1, (B) tissue factor and (C) thrombomodulin as a function of shear exposure magnitude and albumin additive, as measured by ELISA. All data are reported as the mean ± SEM of independent experiments. * Significantly different from no added albumin and paired BSA (paired by shear stress, three-way ANOVA, P< 0.05), + Significantly different than 0.4Pa (paired by additive, three-way ANOVA, P< 0.05). |