 |
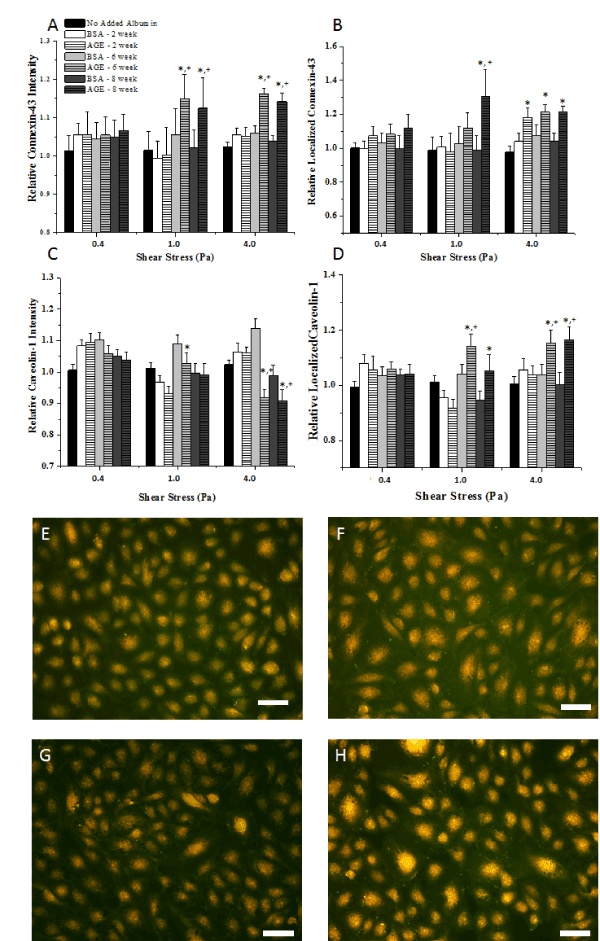
| Figure 4: Endothelial cell (HUVEC) expression of connexin-43 and caveolin-1 as a function of shear exposure magnitude and albumin additive, as measured by immunofluorescence microscopy. All data are reported as the mean ± SEM of independent experiments for intensity (A,C) and localization (B,D). Representative immunofluorescence images (connexin-43, green; caveolin-1, red; co-localization, yellow; all exposed to 4Pa) are shown for no added albumin (E), AGE – 6 week (F), BSA – 8 week (G) and AGE – 8 week (H). Scale bars are 100µm.* Significantly different from no added albumin and paired BSA (paired by shear stress, three-way ANOVA, P< 0.05), + Significantly different than 0.4Pa (paired by additive, three-way ANOVA, P< 0.05). |