|
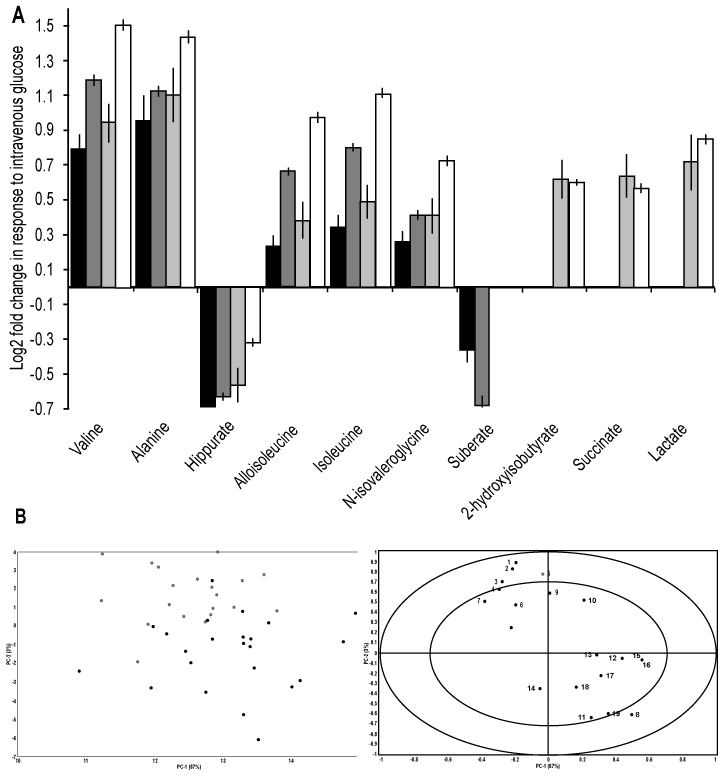
| Figure 1: A. Log2 fold changes of consistently differential metabolites as detected by NMR after median normalisation (black: 2010, dark grey: 2011 results) or creatinine normalisation (light grey: 2010, white: 2011 results) working at the 95% confidence level after Bonferroni correction of the p-values. B. PCA scores and loadings plot for median normalisation indicating significantly changing metabolites (2011 data, black = pre, grey = post intravenous glucose). Number identifiers refer to corresponding metabolites listed in Table 1. |