 |
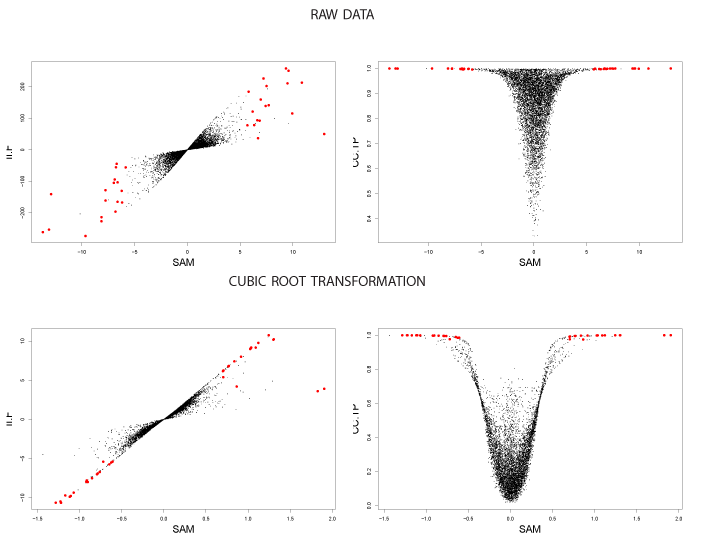
| Figure 6: Comparisons of the II.F, CC.TP and SAM statistics on the Tusher data. Genes selected by SAM are highlighted in red for reference. Here the CC.F and II.TP statistics were identified from Tables 4, 5 and 6 as the optimal statistics for detecting large signal changes for the II and CC models. For this data set, the II model is supported under the cubic transformations while the CC model is supported for the raw data. |