|
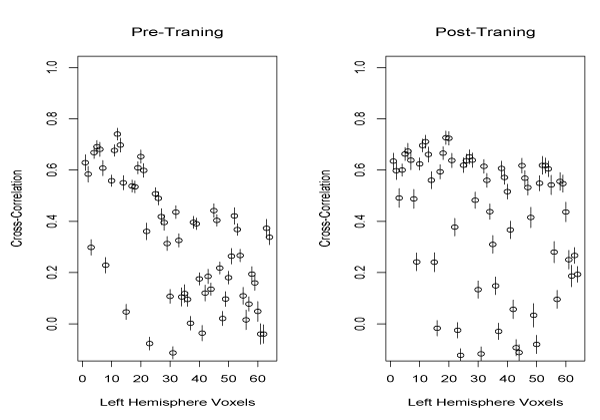
| Figure 7: Simultaneous confidence intervals for cross-correlations. Cross-correlations are shown for one right hemisphere voxel and all left hemisphere voxels from the region of interest. Left and right diagrams correspond to pre-training and post-training sessions, respectively. |