 |
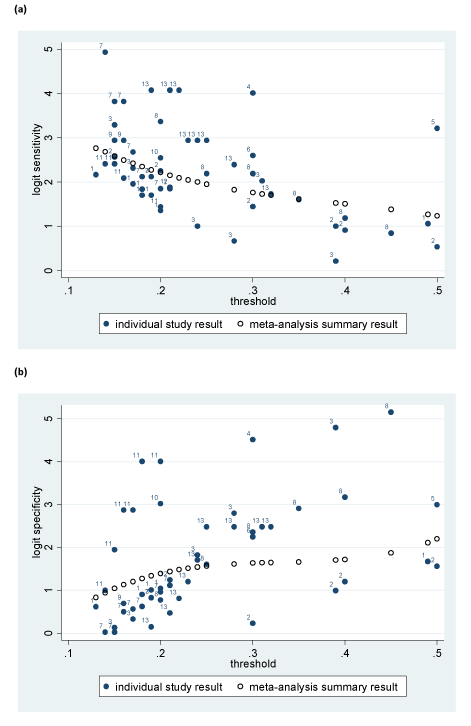
| Numbers next to the points denote study ID number. In each figure, the hollow circles are ordered in terms of threshold value, from a PCR of 0.13 for the circles farthest right, and a PCR of 0.50 for the circles farthest left. |
| Figure 2: Fit of meta-analysis model (9) with a cubic summary relationship between threshold value and (a) the study logit sensitivity estimates, and (b) the study logit specificity estimates. |