 |
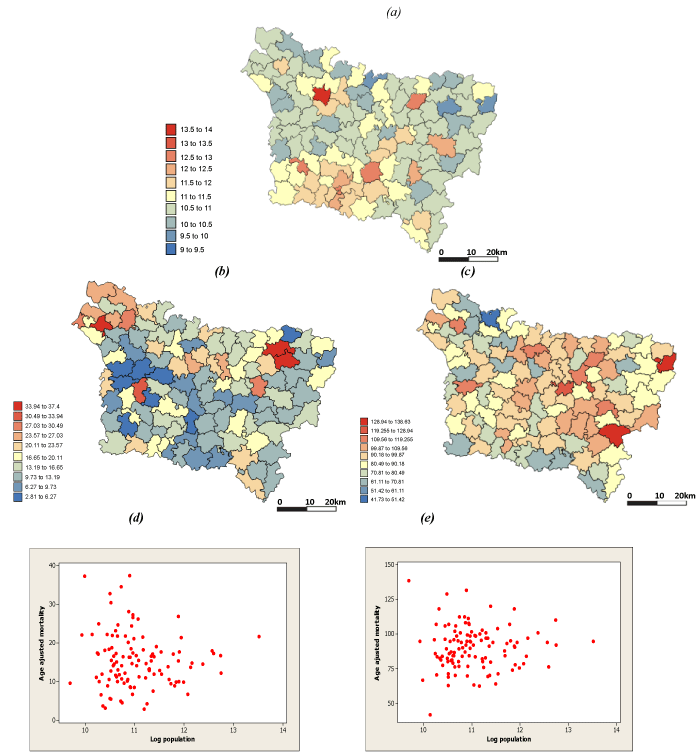
| Figure 2: (a) Map of log population density. Geographic distribution of age-adjusted mortality rates per 100,000 person-years recorded over the period 2000–2009 for: (b) lip, oral cavity and pharynx; (c) lung cancer mortality. The bottom scatter plots illustrate: (d) the age-adjusted mortality rates for lip, oral cavity and pharynx cancers plotted against population density and (e) the age-adjusted mortality rates of pleura cancers plotted against population density. |