|
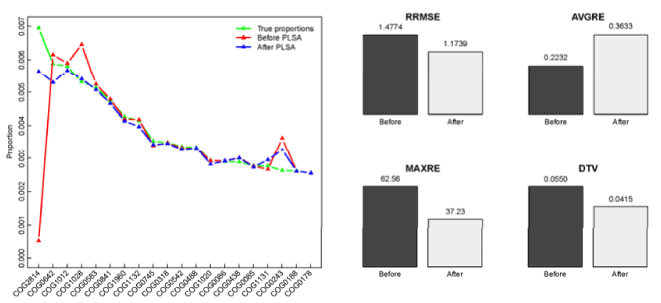
| Figure 4: Comparison of COG functional profiles of Simu before and after the cross-annotation corrected by PLSA modeling method: the estimated proportions of the truly most 20 abundant COGs (left); the accuracies of the estimates of the complete functional profiles, evaluated by the four measurements (right). |