|
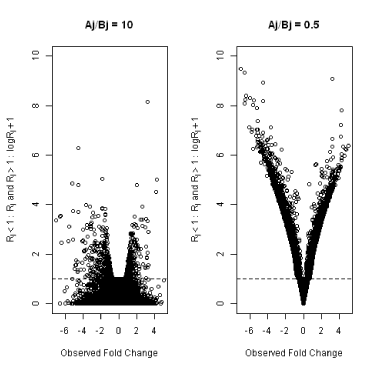
| Figure 5: Modified volcano plot combining the two perspectives for the two different weight ratios: On the vertical axis Rj is plotted if Rj<1 and (log10Rj+1) if Rj>1where log10 transformation+1 of Rj>1 allows for better visualization of extreme values. A high weight factor emphasizes the variance protecting for type I errors, while a low weight factor emphasizes the observed fold changes. |