 |
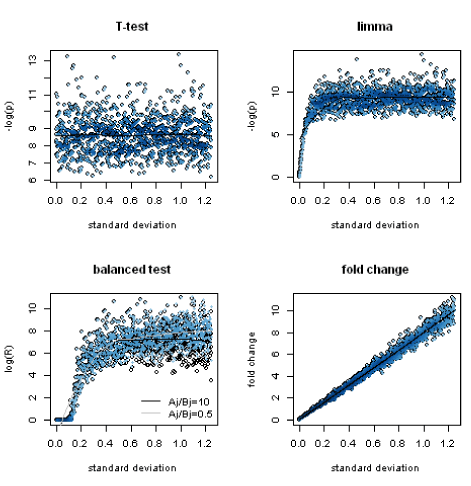
| Figure 9: Simulation of genes with fixed T-statistic but varying fold changes and standard deviations: a) Significance is plotted in function of the standard deviation for the T-test (upper left) where no differentiation is found. b) The upper right plot, displays the results for limma where penalization is taken place for low variance genes. c) But most penalization can be found for the balanced test (lower left). Here the Rj values are log10 transformed since all Rj ≥ 1.d) The lower right plot graphs fold changes in function of variance. |