 |
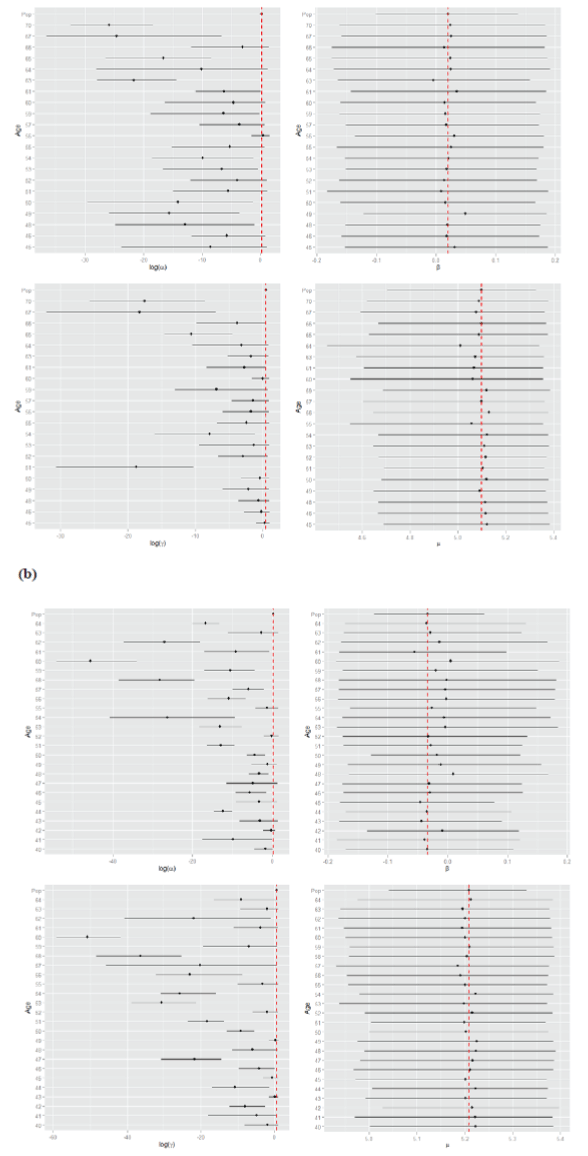
| Figure 1: The forest plots of individual-level estimates of ME-DM. (a) JHLP and (b) HIP. The red dotted lines indicate the means of the posterior population-level estimates of log (α), β, log (γ), and m. The solid dots and the solid lines represent empirical means and 95% credible intervals of the posterior distributions of each estimate. |