 |
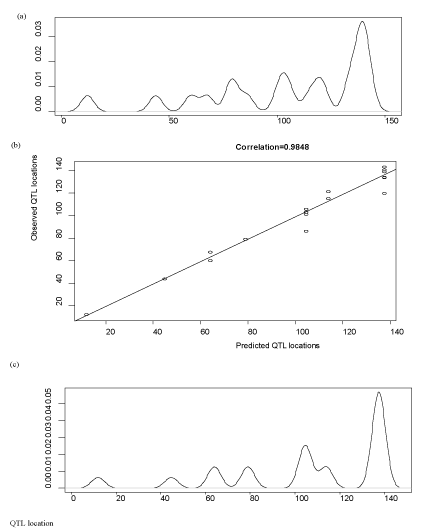
| Figure 6: Average daily body weight gain (ADG) QTL locations on swine chromosome 1: (a) Kernel density plot (bandwidth=5) of ADG QTL locations obtained from 21 primary studies; (b) Correlation between reported ADG QTL locations from 21 primary studies and the estimated QTL locations obtained using the non-parametric meta-analysis model with a Dirichlet process prior (DPP); (c) Posterior distribution of clusters of QTL locations inferred using the DPP model. |