 |
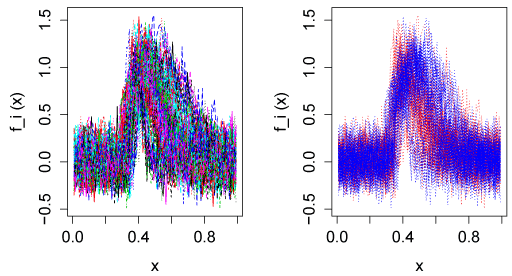
| Figure 4: A sample of 100 simulated functions. There are 50 self-modeling versions of each g1 and g2 mixed into the dataset shown in the left pane (a). The inferential problem is to separate the traces and simultaneously estimate the underlying shape functions. The right pane (b) shows the same dataset but colored according to the underlying groups (unknown in practice but here the red and blue functions are self-modeling versions of g1 and g2, respectively). The different groups are simulated so that they do not separate in groups based on height, width, or other functionals, but only by shape. |