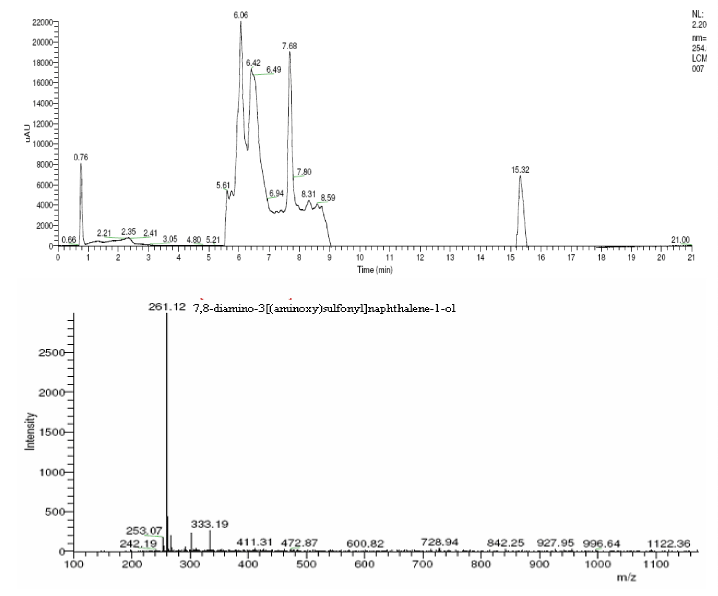
Figure 2c:
Chromatogram of acid red treated with enzyme (3 h) (b) Mass spectra of acid red after 3 h.