 |
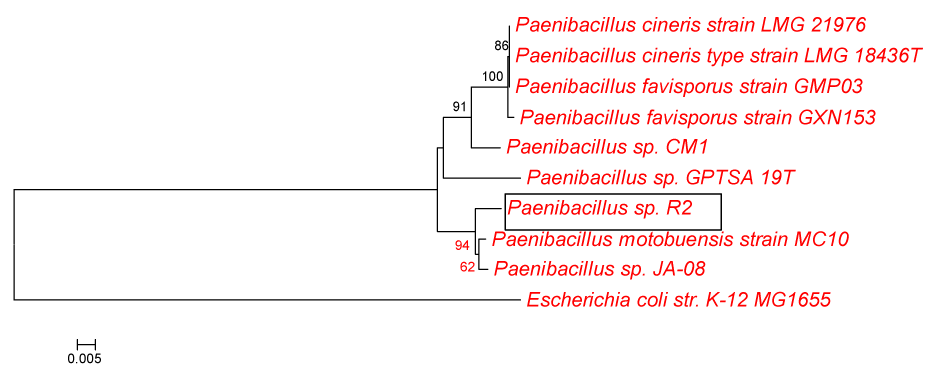
| Figure 1: Phylogram show phylogenetic relationships of bacterium R2 and selected Paenibacillus sp. based on partial 16S rRNA sequences retrieved from raw textile wastewater. The trees were calculated by the neighbor-joining algorithm and a 50% conservation filter. The numbers in parentheses indicate the frequency of appearance of completely identical sequences strain among the total strains. E. coli is used as the outgroup. The scale bar denotes 0.5% sequence divergence, and the numbers at the nodes represent bootstrap values (500 replicates). |