 |
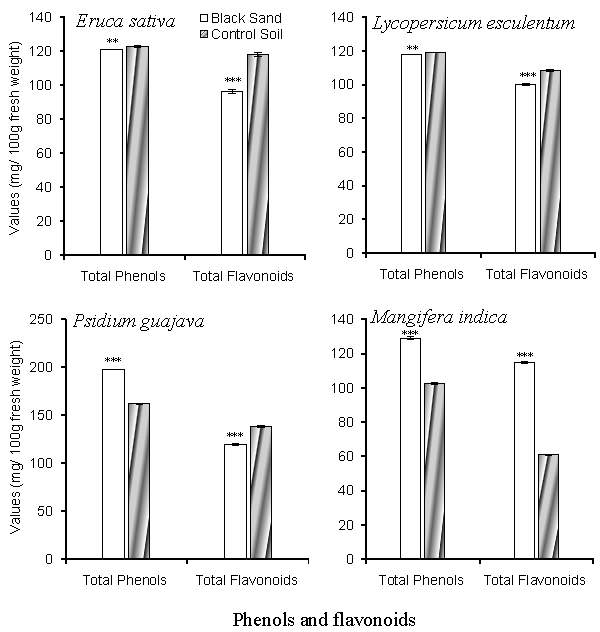
| Figure 4: Total phenolic compounds and total flavonoid content (mg/100 g fresh weight edible portion) of the four study plant species cultivated in the coastal black sand and in the inland sites. Vertical bar around the mean is the standard deviation. Stars indicate significant differences, *** significant at P ≤ 0.001; ** significant at P ≤ 0.01 and * significant at P ≤ 0.05. |