 |
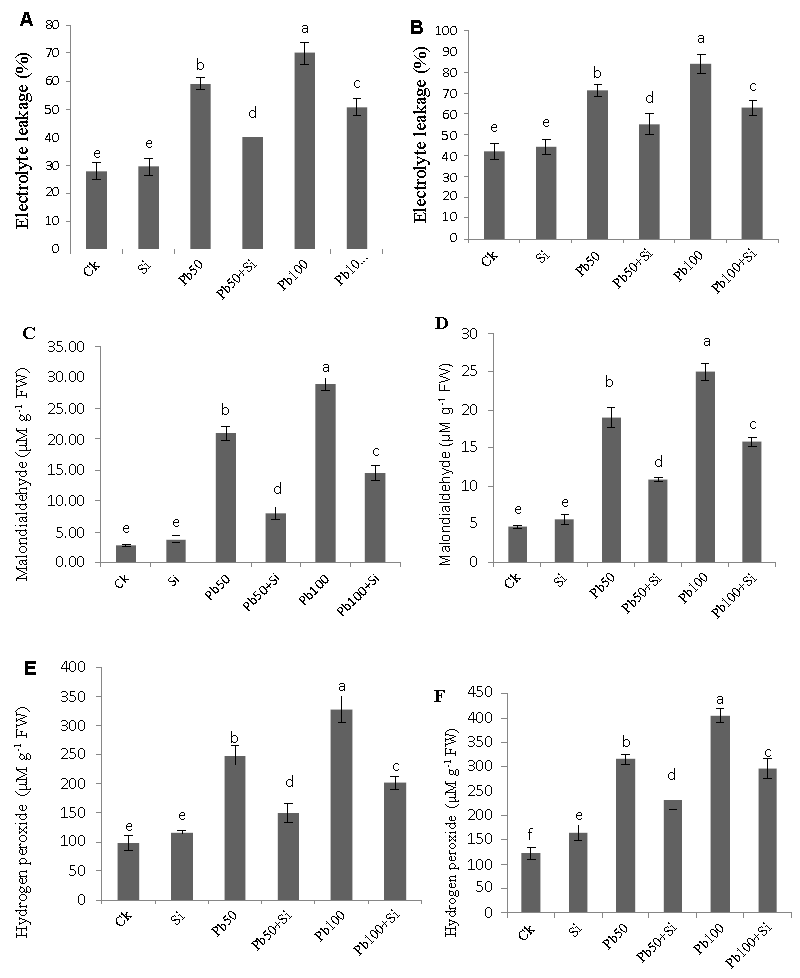
| Figure 6: Effect of different concentrations of lead (Pb) (0, 50 and 100 μM) and silicon (0 and 1 mM) on electrolyte leakage of leaf (A), root (B), malondialdehyde of leaf (A) root (B) and hydrogen peroxide of leaf (A), root (B) in cotton plants. Values show the means of three replicate ± SE. Means followed by same small letters are not significant different at P ≤ 0.05 by using the Tukey test. |