 |
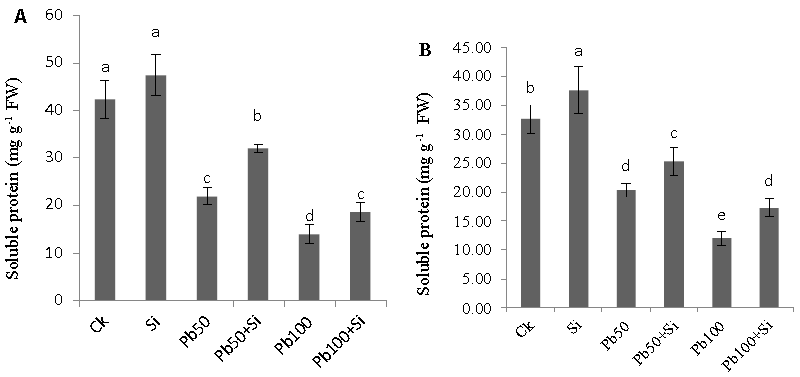
| Figure 7: Effect of different concentrations of lead (Pb) (0, 50 and 100 μM) and silicon (0 and 1 mM) on soluble protein contents of leaf (A) and root (B) in cotton plants. Values show the means of three replicate ± SE. Means followed by same small letters are not significant different at P ≤ 0.05 by using the Tukey test. |