 |
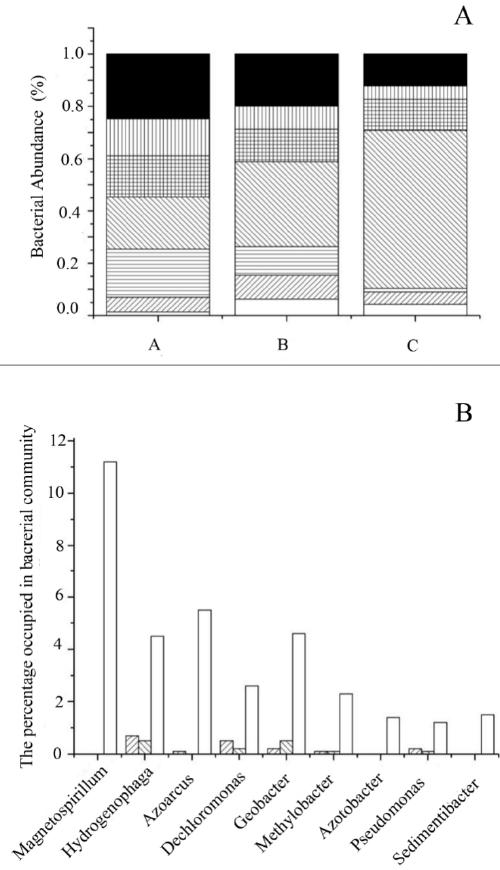
| Figure 3: (A) Abundance of bacteria in sample A, sample B , and sample C. (Acidobacteria (▢), Actinobacteria (▨) Bacteroidetes (▥), Chloroflexi (▤), Proteobacteria (▧), Firmicute (▦), and others (■)) based on 454 pyrosequencing. The y-axis represents the percentage of each phylum. (B) The percentage of Magnetospirillum, Hydrogenophaga, Azoarcus, Dechloromonas, Geobacter, Methylobacter, Azotobacter, Pseudomonas, and Sedimentibacter in microbial community in sample A(▨), sample B (▧) and sample C (▢). |