 |
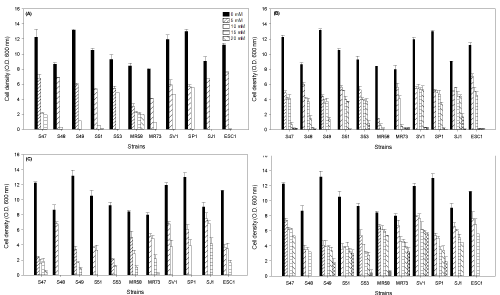
| Figure 1: Tolerance expressed by cell density (D.O. 600 nm) of yeasts grown in the presence of xylene (A), toluene (B), n-heptane (C) and hexene (D) for 48 h at 28°C and 180 rpm. The lateral legend shows the concentrations of hydrocarbons in mM. Data are the mean of three replicates, and error bars represent standard deviation. |