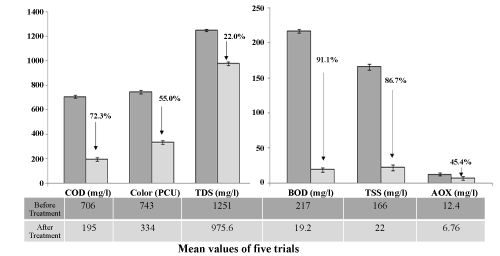
Figure 3:
Verification experiment (graph depicts the values of before and after the treatment of wastewater with the arrow showing the percentage reduction after the treatment).