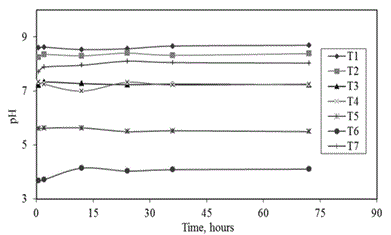
Figure 1:
Schematic representation of pH values during the process of phenol adsorption for studied soil matrices.