 |
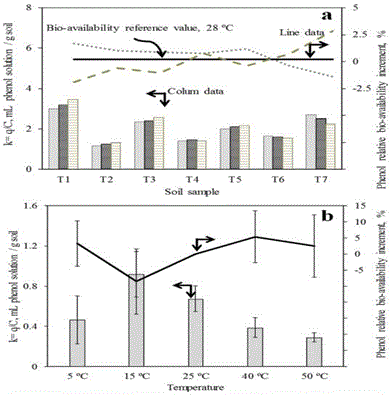
| Figure 4: Schematic representation of temperature effect on phenol soil adsorption. Here is possible to observe the changes on phenol adsorption equilibrium, colums, and phenol bio-availability, lines, for temperature intervals of 28 ± 2ºC (A) and 27.5 ± 22.5°C (B). Data representation: A. Dots equal to 26ºC, continuous lines equal to 28ºC and slashes equal to 30ºC; B. Experimental data for soil sample T1 with reference temperature of 25ºC. |