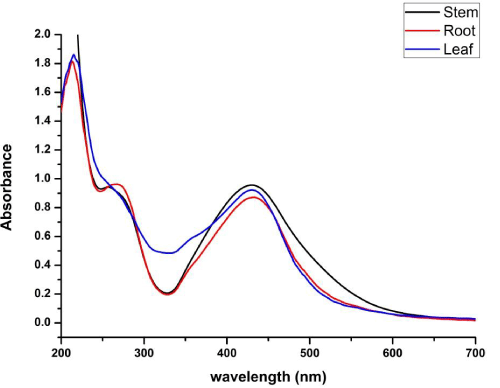
Figure 1:
UV–visible absorption spectra of sample S, R and L.