 |
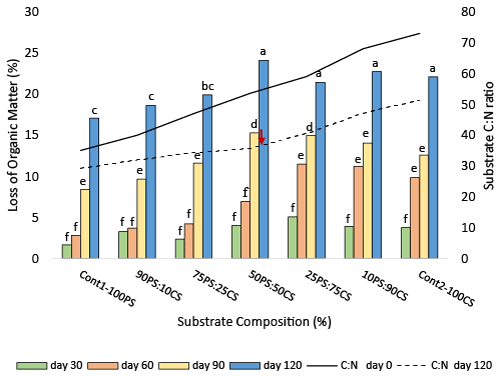
| Figure 1: Losses in substrate organic matter (bar chart) and changes in substrate carbon: nitrogen ratio (Line graph) during a 120 day solid state fermentation of peanut shells (PS) and cornstalks (CS) substrates with Pleurotus ostreatus. Cont1-100PS and Cont2-100CS are controls composed of 100% peanut shells and 100% cornstalks respectively. Means with same letters on bar chart are not significantly different (p<0.05)=arrow shows where the highest reduction in C:N ratio occurred. |