|
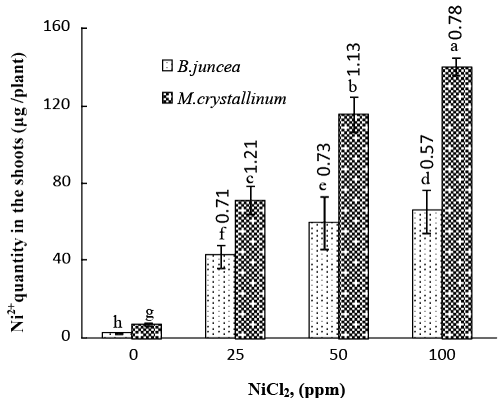
| Figure 3: Nickel amount (μg plant−1) in shoots of M. crystallinum and B. juncea. The values above histograms correspond to the bioconcentration factor (BCF) for Ni-treated plants. Plants were exposed for 3 months to increasing NiCl2 concentrations in the soil. Means (n = 6 per treatment ± SE) with at least one same letter are not significantly different at P ≤ 0.05. |