 |
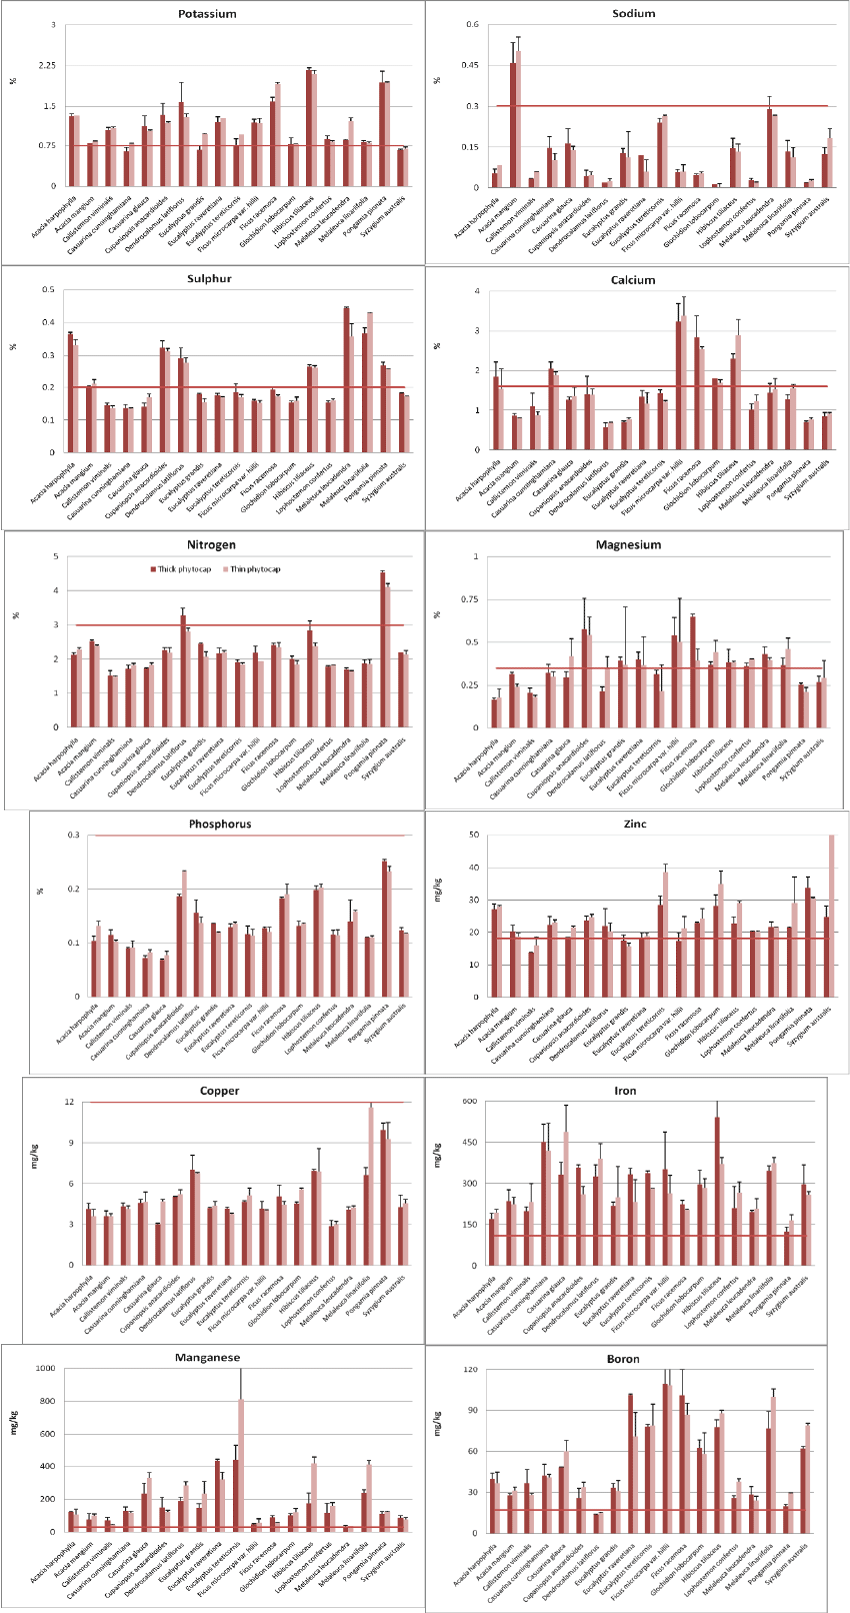
| Figure 5: Average foliar nutrient concentrations in 3 year-old species grown in Thick and Thin phytocapping systems, Bars represent standard errors. The horizontal line shows the optimum levels recommended for normal growth of plants according to Table 3. |