 |
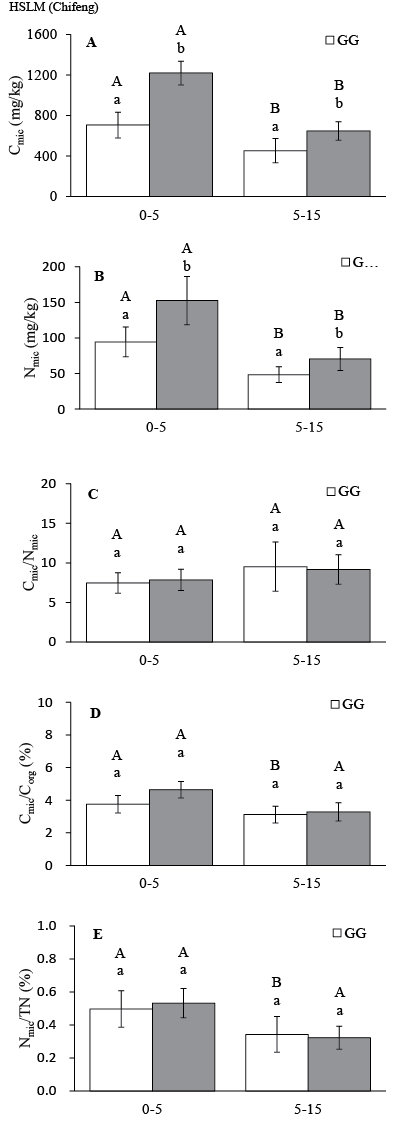
| Figure 2: Values of Cmic (A), Nmic (B), Cmic/Nmic ratio (C), Cmic/Corg ratio (D) and Nmic/TN ratio (E) between GG and EG in two layers in HSLM. Cmic=microbial biomass carbon; Nmic=microbial biomass nitrogen; Corg=total organic carbon; TN=total nitrogen. Vertical bars indicate standard errors of the means (n=5). Bars with the Different lowercase letters indicate significant differences between GG and EG (P<0.05), uppercase letters indicate significant different between the two layers (P<0.05). |