 |
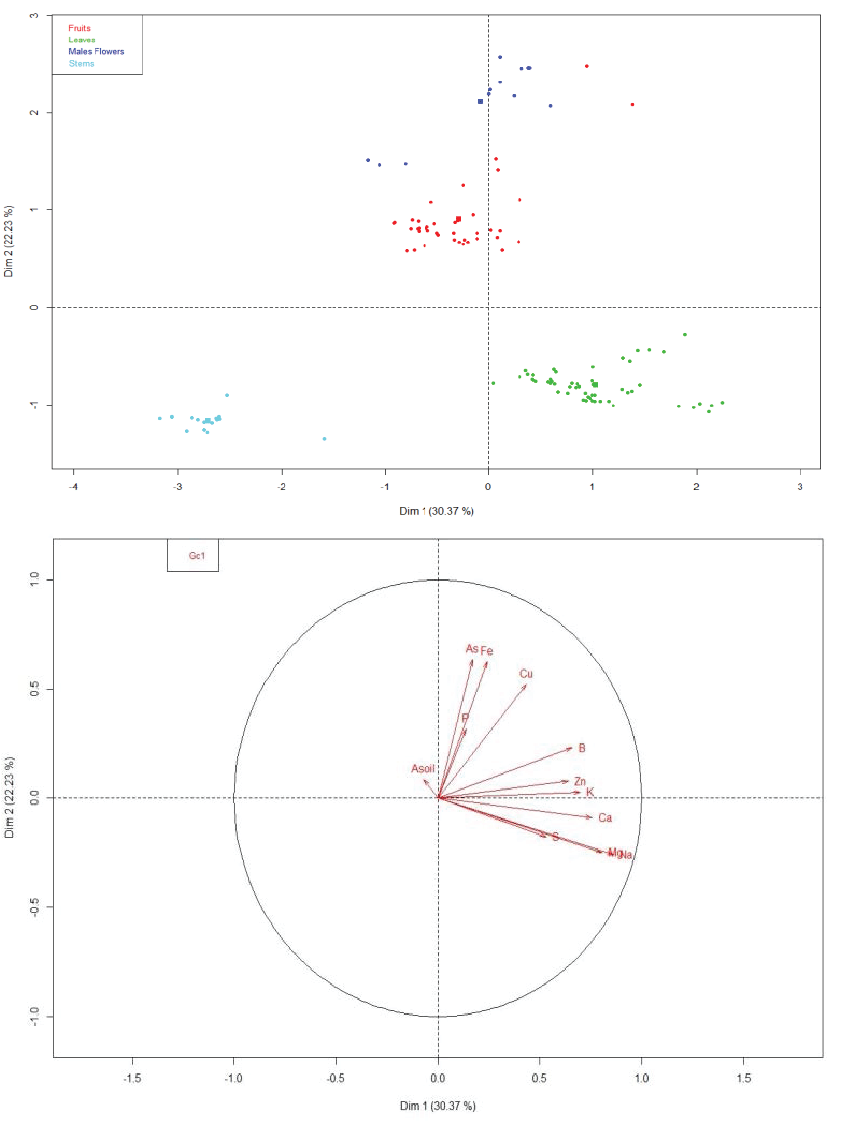
| Figure 3: A) Principal component analysis (PCA) allowing to discriminate between stems (light blue), leaves (green), fruits (red) and male flowers (dark blue) ionome of Atriplex atacamensis growing on the As-contaminated site of Quillagua; B) Axis composition for PCA analysis. The size of each arrow indicate the level of correlation and its projection on the axis determines its influence on each dimension. |