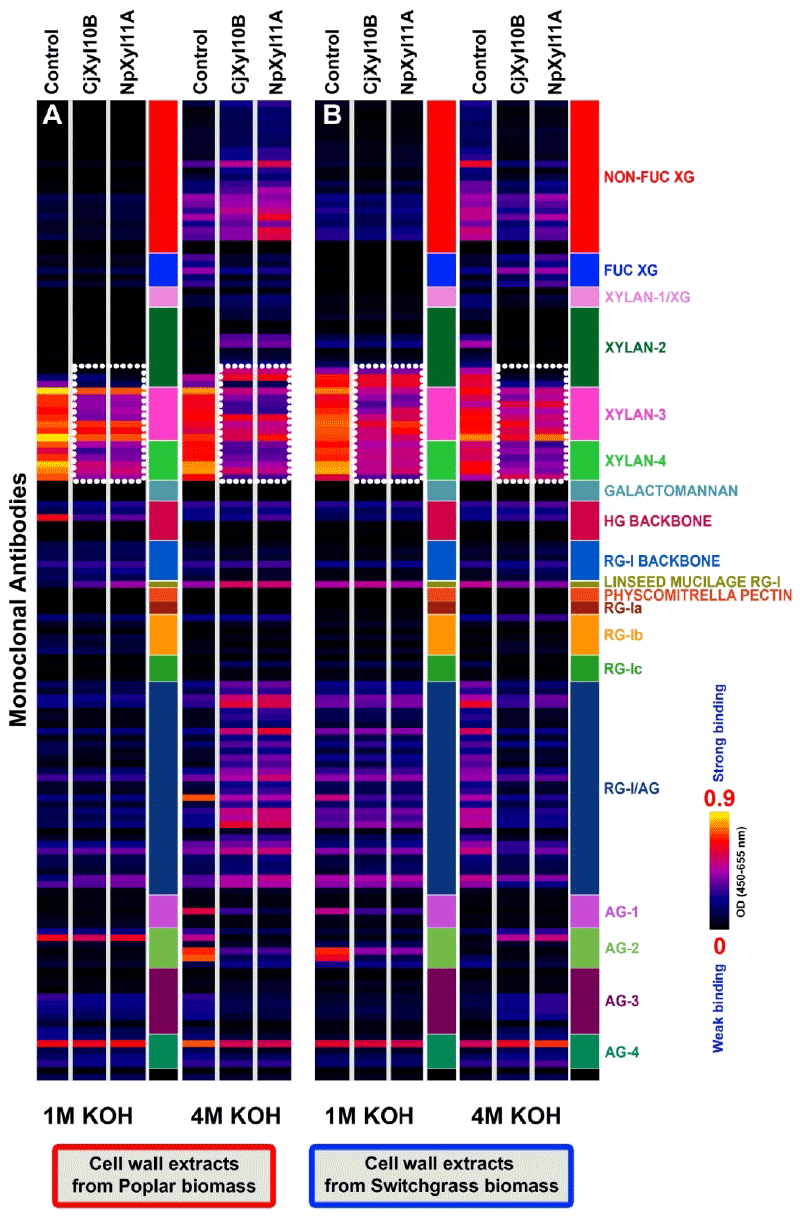
The panel on the right hand side depicts classes of McAbs that are specific to various plant cell wall glycans. The intensity of the McAb binding was depicted as heatmap with a black-blue-red-yellow-white color scheme with white color depicting strongest binding and black depicting no binding. The white-dotted boxes highlight the xylan epitopes that are most prominently affected by the enzyme treatments in each extract.