 |
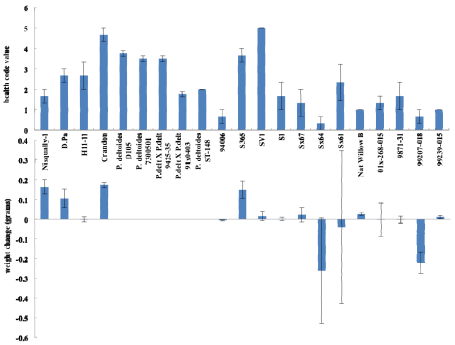
| Figure 3: Average health and average weight change of plant lines after one week exposed to 200 μg/mL TCE. Health code given on a 0 to 5 scale, 5 given to plants that exhibited new growth during week and no sign of chlorosis, 0 being given to dead plants. P. deltoides clones were omitted from weight change graph and Pearson product-moment correlation coefficient test because weight on day zero was not recorded. |