 |
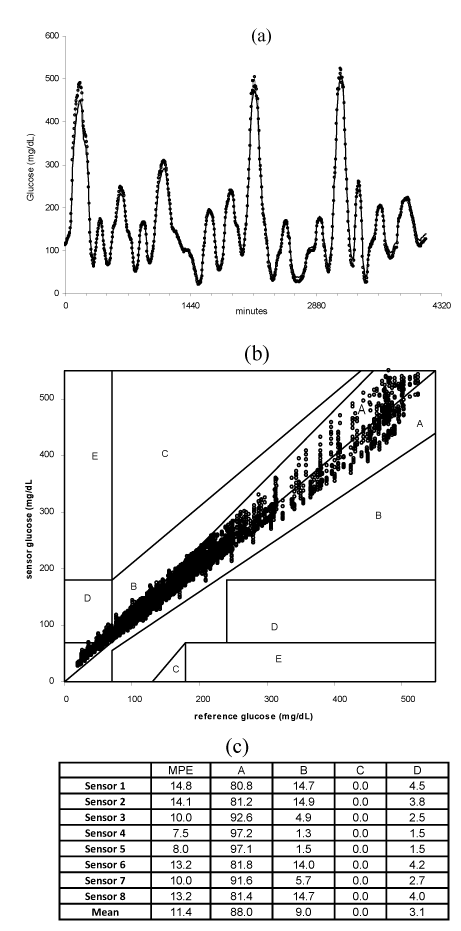
| Figure 4: Sensor outputs in continuous flow test in buffered solution at 34°C. 4a) The top panel shows the multi-day glucose profile of a single sensor response (line) overlaid on the YSI reference values (filled points/line) 4b) The bottom panel shows output from 10 sensors tested using similar glucose profi les on a Clarke-error grid. The average MPE for the 10 sensors was 11.4%. 4c) Table showing MPE and Clarke region percentages for sensors in Figure 4b tested in continuous flow in buffered solutions. |